

Renewable energy is defined as energy that is not emanated from fossil or nuclear fuel but derived from natural resources that are predictably replenished at a faster rate than they are consumed such as hydro, solar, wind, geothermal, and biomass.
There is a wide range of recognition from all over the world that renewable energy and energy efficiency are critical not only for addressing climate change, but also for creating new economic opportunities to access energy for the billions of people still living without modern energy services. Over the past decade, and particularly in recent years, advances in renewable energy technologies, global increases in capacity, and rapid cost reductions have been due largely to policy support, which has attracted significant investment and has further driven down costs through economies of scale.
Here is a graphical representation of global energy consumption in 2013:
 It can be seen from the graph presented above that renewable energy provided an estimated 19.1 percent of global final energy consumption in 2013. According to the Global Status Report published by Renewable Energy Policy Networking for the 21st Century on the subject of Renewables 2015, renewable energy continued to grow in 2014 against the backdrop of increasing global energy consumption and a dramatic decline in oil prices during the second half of the year.

It was also reported that heating capacity grew at a steady pace, and the production of biofuels for transport increased for the second consecutive year, following a slowdown in 2011–2012. The most rapid growth, and the largest increase in capacity, occurred in the power sector, led by wind, solar photovoltaic (PV) and hydropower. Growth has been driven by several factors, including renewable energy support policies and the increasing cost-competiveness of energy from renewable sources. In many countries, renewables are broadly competitive with conventional energy sources. At the same time, growth continues to be tempered by subsidies to fossil fuels and nuclear power, particularly in developing countries.

As far as the development of renewable heating, cooling, and transport still lags behind that of renewable power. Low fossil fuel prices, ongoing fossil fuel subsidies, and competition with other possible investments, such as energy efficiency improvements and other renewable energy systems, further slowed the potential of the renewable heat sector. Despite multiple potential entry points for renewable energy in the transportation sector, development has been limited, and the primary focus of policies, markets, and industries has been on liquid biofuels.
Here is a graph illustrating the status of renewable power in 2014:

Although Europe remained an important market and a centre for innovation, activity continued to shift towards other regions. China again led the world in new renewable power capacity installations in 2014, and Brazil, India, and South Africa accounted for a large share of the capacity added in their respective regions. An increasing number of developing countries across Asia, Africa, and Latin America became important manufacturers and installers of renewable energy technologies.
In parallel with growth in renewable energy markets, 2014 saw significant advances in the development and deployment of energy storage systems across all sectors. The year also saw the increasing electrification of transportation and heating applications, highlighting the potential for further overlap among these sectors in the future. Here the following three major findings of the report:
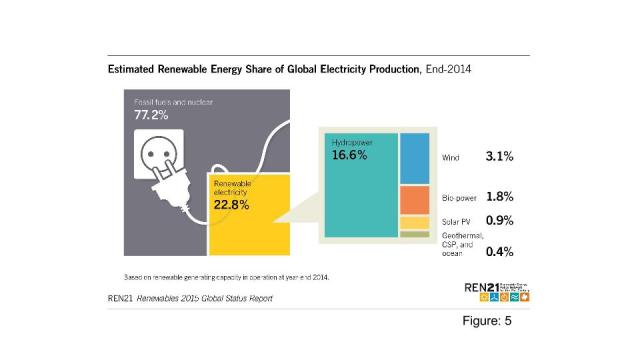
- POWER: More Renewables Capacity Added than Coal and Gas Combined: Renewables represented approximately 58.5 percent of net additions to global power capacity in 2014, with significant growth in all regions. Wind, solar PV, and hydro power dominated the market. By year’s end, renewables comprised an estimated 27.7 percent of the world’s power generating capacity, enough to supply an estimated 22.8 percent of global electricity.
| Renewable Energy – POWER Indicators 2014 | ||||||
| Source: REN21 Renewables 2015 Global Status Report | ||||||
| Description | QTY | 2004 | 2013 | DIFF | 2014 | DIFF |
| Total Renewable Power Capacity (Not included Hydro Power) | GW | 85 | 560 | 475 | 657 | 182 |
| Total Renewable Power Capacity (Included Hydro Power) | GW | 800 | 1,578 | 778 | 1,712 | 134 |
| · Total Hydro Power Capacity | GW | 715 | 1,018 | 303 | 1055 | 37 |
| · Total Bio-Power Capacity | GW | 36 | 88 | 52 | 93 | 5 |
| · Total Bio-Power Generation | TWh | 227 | 396 | 169 | 433 | 37 |
| · Total Geothermal Power Capacity | GW | 8.9 | 12.1 | 3.2 | 12.8 | 0.7 |
| · Solar PV Capacity | GW | 2.6 | 138 | 135.4 | 177 | 39 |
| · Total Concentrating Solar Thermal Power | GW | 0.4 | 3.4 | 3 | 4.4 | 1 |
| · Total Wind Power Capacity | GW | 48 | 319 | 271 | 370 | 51 |
| GW: Gigawatt | TWh: Tearwatt Hours | |||||
Variable renewables are achieving high levels of penetration in several countries. In response, policymakers in some jurisdictions are requiring utilities to update their business models and grid infrastructure. Australia, Europe, Japan, and North America have seen significant growth in numbers of residential “prosumers”— electricity customers who produce their own power. Major corporations and institutions around the world made substantial commitments in 2014 to purchase renewable electricity or to invest in their own renewable generating capacity;
2. HEATING AND COOLING: Slow Growth but Vast Potential – Key for the Energy Transition:

About half of total world final energy consumption in 2014 went to providing heat for buildings and industry, with modern renewables (mostly biomass) generating approximately 8 percent of this share. Renewable energy also was used for cooling, a small but rapidly growing sector. The year saw further integration of renewables into district heating and cooling systems, particularly in Europe; the use of district systems to absorb heat generated by renewable electricity when supply exceeds demand; and the use of hybrid systems to serve different heat applications.
| Renewable Energy – HEAT Indicators 2014 | ||||||
| Source: REN21 Renewables 2015 Global Status Report | ||||||
| Description | QTY | 2004 | 2013 | DIFF | 2014 | DIFF |
| Total Solar Hot Water Capacity | GWth | 86 | 373 | 287 | 406 | 33 |
| GW: Gigawatt | ||||||
Despite such innovations and renewables’ vast potential in this sector, growth has been constrained by several factors, including a relative lack of policy support; and
3. TRANSPORT: Driven by Biofuels, with E-Mobility Growing Rapidly: In the transport sector, the primary focus of policies, markets, and industries has been on liquid biofuels.
| Renewable Energy – TRANSPORT Indicators 2014 | ||||||
| Source: REN21 Renewables 2015 Global Status Report | ||||||
| Description | QTY | 2004 | 2013 | DIFF | 2014 | DIFF |
| Annual Ethanol Production | BL | 28.5 | 87.8 | 59.3 | 94 | 6.2 |
| Annual Biodiesel Production | BL | 2.4 | 26.3 | 23.9 | 29.7 | 3.4 |
| BL: Billion Litres | ||||||

The share of renewables in transportation remains small, with liquid biofuels representing the vast majority. Advances in new markets and in applications for biofuels—such as commercial flights being fueled aviation biofuel—continued in 2014. Relatively small but increasing quantities of gaseous biofuels, including bio-methane, also are being used to fuel vehicles. Increased electrification of trains, light rail, trams, and both two- and four-wheeled electric vehicles is creating greater opportunities for the integration of renewable energy into transport.
According to the report, here is the status of global new investment:
| Description | 2004 | 2013 | DIFF | % | 2014 | DIFF | % | |
| New Investment (Annual) | Billion | |||||||
| in Renewable Power & Fuel | USD | 45 | 232 | 187 | 415.56 | 270 | 38 | 16.38 |
Global new investment in renewable power and fuel was up 415.56 percent over 2004 whereas it was up 16.38 percent over 2013, to USD 270 billion, including the unreported investments in hydropower projects larger than 50 MW, total new investment in renewable power and fuels reached at least USD 301 billion.
Renewables outpaced fossil fuels for the fifth year running in terms of net investment in power capacity additions. This first increase in three years was due in part to a boom in solar power installations in China and Japan, as well as to record investments in offshore wind projects in Europe. All regions of the world experienced an increase relative to 2013. Investment in developing countries was up 36 percent from the previous year to USD 131.3 billion. Developing country investment came the closest ever to surpassing the investment total for developed economies, which reached USD 138.9 billion in 2014, up only 3 percent from 2013.

The most significant dollar increase occurred in China, which accounted for almost two-thirds of developing country investment in renewable power and fuels. The Netherlands and Brazil saw the largest percentage increases. Other top countries included the United States, Japan, the United Kingdom, and Germany. Investment continued to spread to new markets throughout 2014, with Chile, Indonesia, Kenya, Mexico, South Africa, and Turkey each investing more than USD 1 billion in renewable energy.
Solar power and wind were the leading technologies by far in terms of dollars committed, with solar power (mostly solar PV) accounting for more than 55 percent of new investment in renewable power and fuels (not including hydro >50 MW), and wind power taking 36.8 percent. Both saw significant increases over 2013: solar power investments rose 25 percent to USD 149.5 billion, and wind advanced 11 percent (to USD 99.5 billion). Overall, in 2014, more than a quarter of new investment in renewable energy went to small scale projects (particularly solar PV).
Geothermal power investment grew by 23 percent, and ocean energy (up 100 percent) also fared well although from a very low level. Other renewables did less well: biofuels declined 8 percent to a 10-year low, biomass and waste-to-energy dropped 10 percent, and small-scale hydropower slipped 17 percent.
All investment types saw increases over 2013, with asset finance of utility-scale projects accounting for the vast majority of total investment. The year 2014 also saw the creation of two new South-South development banks: the USD 100 billion New Development Bank created by the five BRICS countries, and the Asian Infrastructure Investment Bank created by 23 Asian countries. The expansion of new investment vehicles for renewables—such as green bonds, yield companies, and crowdfunding—have attracted new classes of capital providers and are helping to reduce the cost of capital for financing renewable energy projects.

International Renewable Energy Agency (IREA) estimates that renewable energy employed 7.7 million people, directly or indirectly, around the world in 2014 (excluding large hydropower). This is an 18 increase from the number reported last year. In addition, IRENA conducted the first-ever global estimate of large hydropower employment, showing approximately 1.5 million direct jobs in the sector.
The graph presented below illustrates the global renwable jobs found among the world’s leading countries in 2014:

It is interesting to note that the emergence of countries such as India and Bangladesh among the leading countries on the graph. This may partly be explained by policymakers in those countries understanding the value of distributed solar PV for tackling still widespread energy poverty in their countries. It is a general practice that as economies and populations grow, standards of living improve for billions of people, and with it the need for energy continues to rise. Or as World Bank Group President Dr. Jim Yong Kim put it “energy is a critical part of boosting prosperity and eradicating poverty.” The world’s center of gravity is shifting more and more toward emerging markets where primary energy consumption is expected to mirror the growth in global population.
Conversely, it is disappointing to see that renewable energy-related employment remains comparatively low on the African continent, the Middle East as well as Australia – prima facie, all locations suitable for a reasonable expansion of at least solar PV. In this respect, the IRENA report points to the fact that “renewable energy employment continues to be shaped by an array of supportive industrial and trade policies.” Consequently, a lack thereof helps to explain subpar growth vis-à-vis other energy sources in those countries.

The graph present above illustrates renewable energy employment by technology in selected countries.
As can be seen from the graph that globally, solar PV installations are clearly in the lead and responsible – directly and/or indirectly – for the creation of “2.5 million jobs, of which two-thirds were in China”. The report also notes that while “falling prices for solar PV and wind equipment globally posed a challenge for manufacturers in some markets, thus affecting jobs, on balance, accelerated solar PV installation and expanded operations and maintenance spurred job growth in other markets.”
Interestingly, the “Manufacturing of solar PV panels moved decisively from Europe and North America to Asia”, according to the report.
Here is a summary of the report:
- Renewable energy jobs reached an estimated 7.7 million in 2014, excluding large hydropower;
- Jobs in the sector increased 18 percent from the estimate reported last year and the regional shifts towards Asia continued, especially in manufacturing;
- The 10 countries with the largest renewable energy employment were China, Brazil, the United States, India, Germany, Indonesia, Japan, France, Bangladesh and Colombia;
- In 2014, the solar PV sector accounted for 2.5 million jobs, of which two-thirds were in China. Solar PV jobs also grew in Japan, while decreasing in the European Union;
- Biofuels (1.8 million), biomass (822,000) and biogas (381,000) are also major employers, with jobs concentrated in the feedstock supply. While Brazil and the United States continued to dominate, Southeast Asia saw growth in biofuel jobs, reflecting measures to support production;
- Wind employment crossed the 1 million mark, with China accounting for half of these jobs. The United States, Brazil and the European Union also saw gains;
- Solar water heating and cooling employed 764,000 people, more than three quarters of them in China. Other significant markets are India, Brazil and the European Union;
- Small hydropower employed about 209,000 people, more than half in China, followed by the European Union, Brazil and India;
- Large hydropower was estimated to support another 1.5 million direct jobs, mostly in China and largely in construction and installation; and
- An array of industrial and trade policies continues to shape employment, with stable and predictable policies favouring job creation.
The three major global challenges relating to energy supply security, investment credit and climate change are interlinked. They are currently attracting the attention of virtually everyone on the planet who has access to information since nobody is exempt from their consequences. To maintain the current quality of life enjoyed by one billion residents in the Organization for Economic Cooperation and Development (OECD) countries, and to improve it for many others, especially the two billion living in the least developed countries with only very basic energy services, society may need to accept a new economic and technical approach that can cause civilization to move along the lines of a new paradigm.
Making the necessary transition for the global energy sector from the fossil fuel era to a “post-carbon” era will not be an easy task, especially since sustainable development is a parallel objective that should include the more sustainable use and more equitable share of the limited resources, including energy, for all humankind.
Here is a reality worldwide, the urban population is increasing by around one million people per week. This includes people driven in from the rural areas by an increasing frequency of droughts and floods and other probable consequences of climate change. The challenge to provide basic energy services for the larger number of city-dwellers in future, in order to provide an acceptable quality of life for everyone whilst also reducing GHG emissions, is daunting (not to mention providing clean water, food, sanitation and mobility). Increasing the contribution from local renewable energy sources, together with using energy more wisely and efficiently than we do now, will become a major part of the solution.
Here is another reality. The future of renewable energy is fundamentally a choice, not a foregone conclusion given technology and economic trends. The context for that choice includes the present situation—high levels of current investment and more than a decade of dramatic market growth, proliferation of support policies, and cost reductions for renewable energy. The context also involves a growing diversity of motivations, such as energy security, climate and environment, industrial and economic development, financial risk mitigation, flexibility, and resilience.
Resources:
- REN21: Renewables 2015 – Global Status Report;
- IRENA: Renewable Energy and Jobs – Annual Review 2015;
- Energy: Renewable Energy Employment on the Rise Globally;
- Energy: Tackling Energy Poverty with Renewables;
- IEA: Cities, Towns and Renewable Energy; and
- REN21: Renewables Global Status Report.